50 Golden Rules of Stock Market Trading I’m sure most everybody knows these truisms in their hearts, but this list is nicely edited and makes a good read. 1. Plan your trades. Trade your plan. 2. Keep records of your trading results. 3. Keep a positive attitude, no matter how much you lose. 4. Don’t take the market home. 5. Continually set higher trading goals. 6. Successful traders buy into bad news and sell into good news. 7. Successful traders are not afraid to buy high and sell low. 8. Successful traders have a well-scheduled planned time for studying the markets. 9. Successful traders isolate themselves from the opinions of others. 10. Continually strive for patience, perseverance, determination, and rational action. 11. Limit your losses – use stops! 12. Never cancel a stop loss order after you have placed it! 13. Place the stop at the time you make your trade. 14. Never get into the market because you are anxious because of waiting. 15. Avoid g...
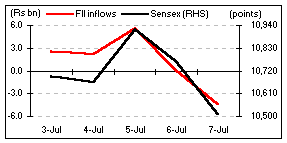
 While the Indian stockmarkets were not generous to investors (declined week-on-week), the rain gods gave a handful to Mumbai and as usual, the city choked during the last week! This did have an impact on the daily volumes traded, which was low in the first three days, only to gain momentum in the later half. Despite a weak start, there was selective buying interest in some sectors. But sentiment was dampened following the Prime Minister's decision to keep disinvestments of public sector units on hold (read Neyveli Lignite Corporation). This time, it was not only the 'Left' that was 'as usual' against the move, but also an important ally from Tamil Nadu (DMK). Incidentally, DMK was a strong supporter of disinvestments of PSUs under the erstwhile NDA government. Besides these domestic concerns, global factors such as North Korea testing missiles and renewed worries about interest rates increasing in Japan added to the nervousness. In this backdrop, it was a tug-of-war between the bulls and the bears with bears winning the battle towards the end of the week.
Comments
Post a Comment